No. of Recommendations: 15
In the past I posted updates to a chart showing the value and price of Brookfield.
After all the stock splits, and change in structure, this became not only more burdensome but increasingly sketchy to ensure that the connecting periods were economically consistent.
Brookfield have helped me in this regard by publishing their 'Plan Value' which is calculated by calculating the asset values using a combination of IFRS values and market values, and then adding the capitalised fee earnings (taking the fee earnings and applying a fixed multiple).
The Plan Value as far as I'm concerned is sensible
conceptually and they calculated the value essentially the same way that I had been doing, adding the assets to a multiple of the fee earnings. Though, the details for the asset values, especially switching between IFRS and market values for different asset classes, I was always a little humoured with. Essentially it is overly optimistic - and openly so - which is also consistent with the stock price remaining below the Plan Value.
Other other hand - the
change in Plan Value I believe is an excellent measure of the change in intrinsic value. I think this point is central, and a means of utilising their Plan Value very constructively. I even don't think there is a very meaningful difference between the change in the Plan Value and the true change in observable intrinsic value, because if the Plan Value is 43% too high, but remains too high from one year to the next, then the change in the value is the same.
There is one thing that I am certain of - the change in the quote bears little relation to the change in value, so the change in Plan Value is exceedingly better to track how the business is going from one year to the next, versus just looking at the stock price.
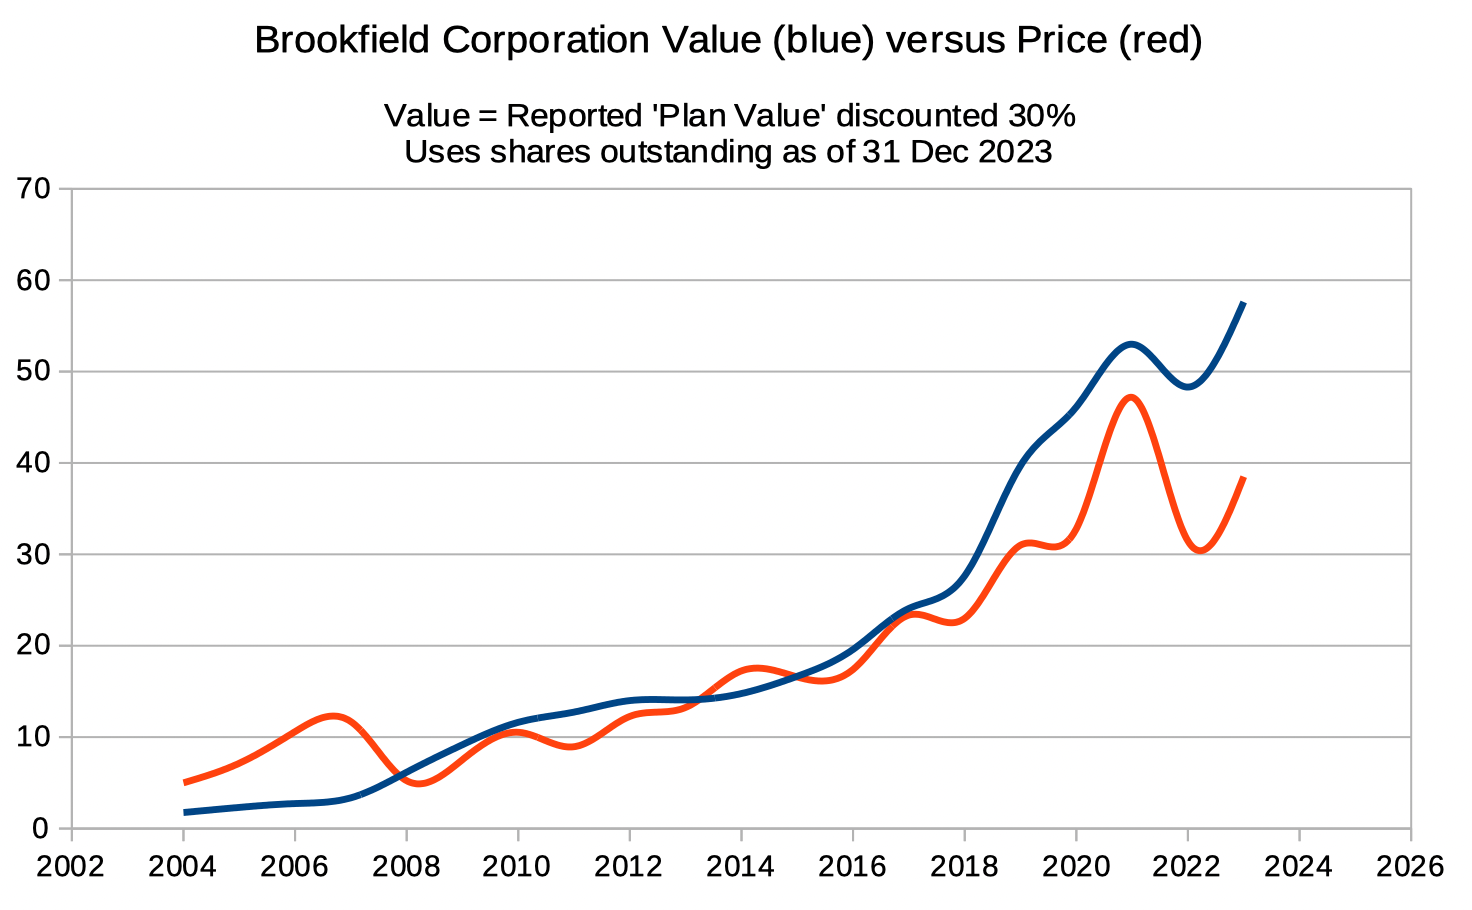
With these point in mind, I have updated my chart to use the reported Plan Value but discounting it 30% as follows:
https://www.shrewdm.com/investing/BN_Plan_Value_Ve...I am discounting the reported Plan Value by 30% only to provide the most typical intersection with the stock quotation, such that we can rely on it intersecting more frequently at that level into the future. I believe the true intrinsic value is higher than this discounted level. If you take any business with a rate of change in the value, and the reliability of this rate of change, being much higher than that of the average company in the Russell 3000, then the business should deservingly trade at a valuation multiple far higher than the average firm.
Brookfield anticipated in their 2023 Investor Day that the Plan Value should continue rising about 17% per year for the next 5 years, which his similar to its past rate of increase. For a decade or so I have tracked what they planned in past presentations, and then compared to the results that they go on to achieve, and they have an impressive record in this regard. They made a big deal out of their carried interest not being appreciated by the market in 2015, and the amount of carried interest that ensued later was higher than they had projected.
Their Plan Value rose 17% per year in the 6 years between 31 Dec 2016 (the end of the year I published Manlobbi's Descent) and 31 Dec 2023. But this also occurred with the borrowing rates rising. If I had known that the 10 year bond would move from 2.4% in late 2016 to 4.4% today, then I would have imagined a larger drag on the asset values as capitalised under IFRS accounting. I'm still surprised today how well businesses, overall, have tolerated the rate rises thus far.
Note that the Plan Value in the above chart does not have the value of the dividends accumulated within the value. They are just assumed to be paid out, because we are comparing the value to the quoted price (of course adjusted for stock splits). So the true rate of change in value produced is about 1% higher than change in reported Plan Value.
The chart ends 31 Dec 2023, and the stock was about 35% underpriced then (compared to this 30% discounted Plan Value that more frequently intersects the price). Since then, over the last 4.5 months, the price has risen 15% and the Plan Value has risen about 6%, so the 35% gap between price and value has closed slightly to around 30%.
- Manlobbi
