No. of Recommendations: 36
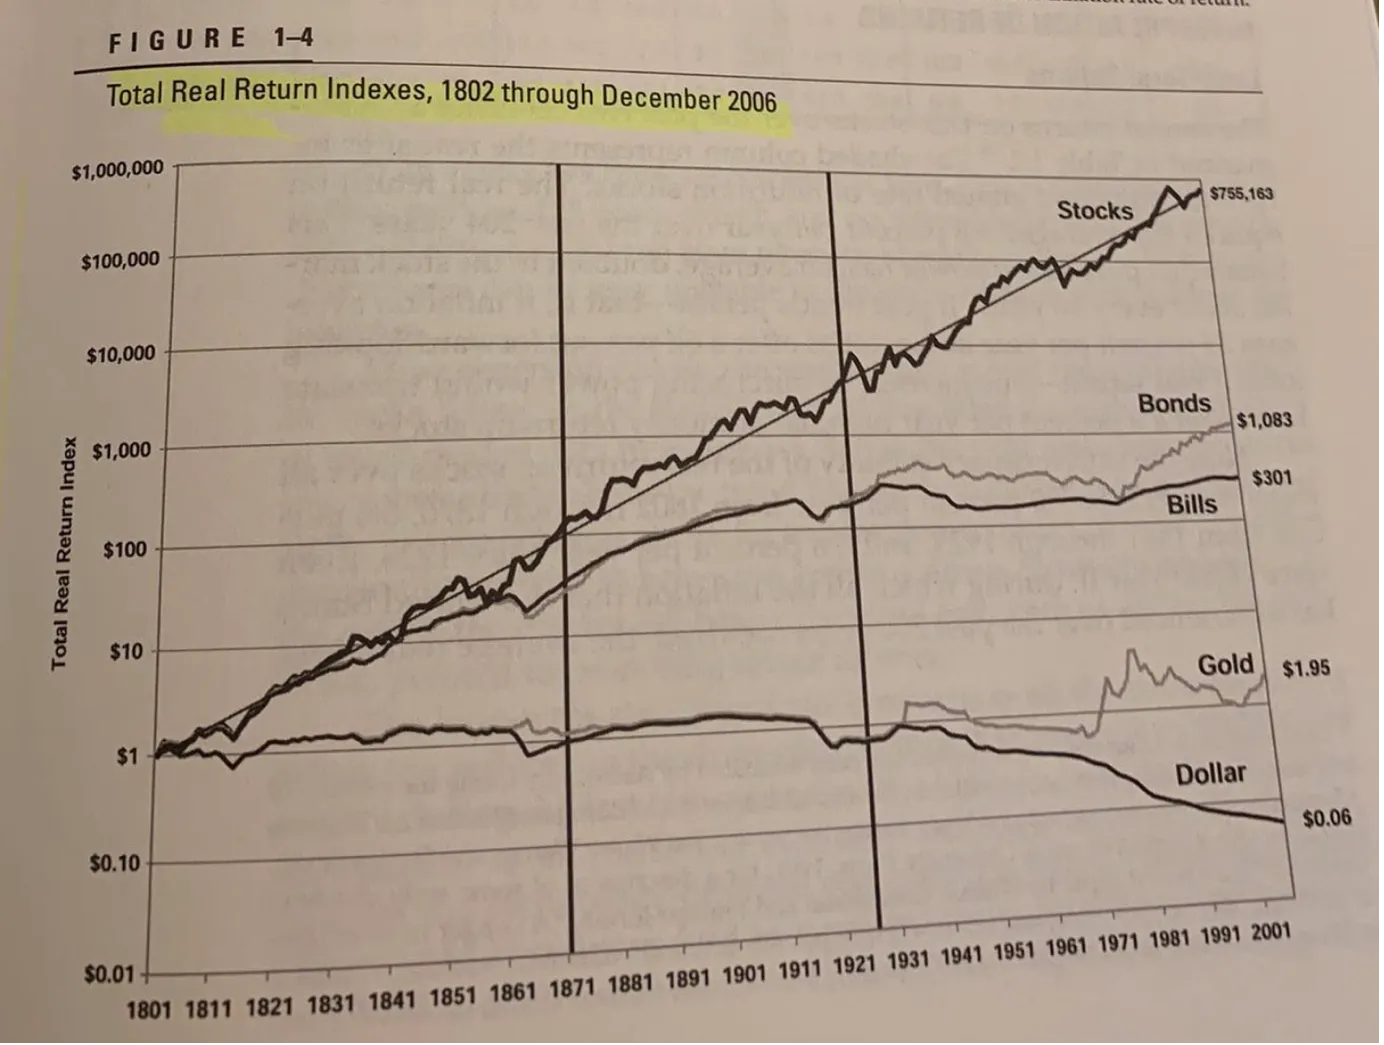
My favorite data set presented by Jeremy Siegel is the comparison of the real total returns* of stocks, bonds, cash and gold - we know the relative long-term returns, but it is good to have a reminder occasionally, and to see how dramatic the contrast is.
https://substackcdn.com/image/fetch/w_1456,c_limit...As many others have observed, the really tough time for investors was during the 1970s, where you had about a one and a half decade stretch without any real total returns. Investing from the peak in 1929 would have led you to wait pleasantly less time - closer to only one decade - before you were permanently in the positive, owing to the deflationary situation and spending power not falling so much. As testing as it would be, I expect I could handle one decade (after all, that is similar many starting in March 2000 and having to wait through 2009, and longer, before the region of permanent positive returns had started).
- Manlobbi
* This is the return that matters to you - it is your actual increase in spending power owing to your investing enterprise. Ignoring dividends is crazy, given that they constitute the bulk of your return historically (in recent year the trend is towards re-investing cash and keeping the dividend payout ratio very low (relative to the past), and applying buy-backs, partly as these are
both more tax friendly, and partly because this is just the fashion for now). Accounting for inflation turns it from a number game into a real life game.
