No. of Recommendations: 8
I subscribed (free) and expected to see text providing reasoning behind the numbers in those graphics. I didn't see any. Is there a specific report one should read to understand how the numbers in those graphics were derived?Maybe so, I don't have a link.
But, having read a lot of their writings, my understanding is that it's pretty simple:
(1) Figure out a decent metric for valuation levels: CAPE, price/book, whatever seems best for the asset class in question
(2) Find the historical average multiple of that metric *
(3) Find the historical average real growth rate of that metric (that's for equities, not necessary for bonds)
(4) Assume that the multiple at year 7 will be its historical average, so 7 year return return = 7 years of annual real metric growth minus (one time valuation change from here to average, annualized)
I don't think they do much if anything in the way of macro forecasting of what else might happen.
They used to do 10 year forecasts, but switched to 7 year.
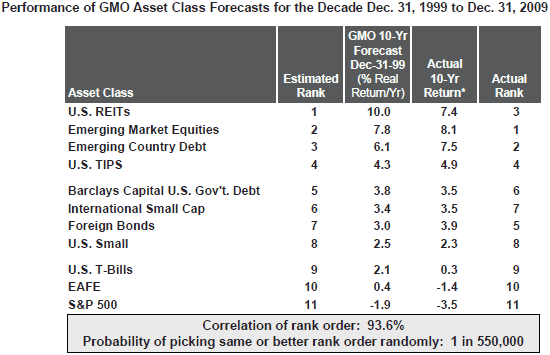
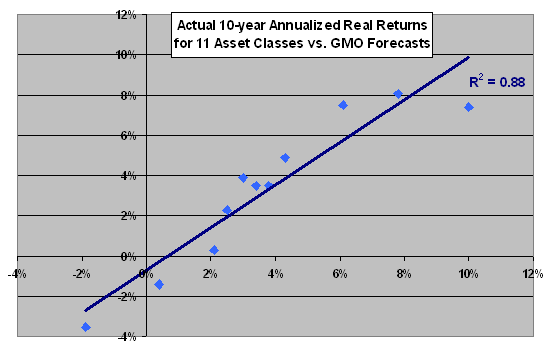
This is what their forecasts look like when occasionally things really do mean revert in the time frame they happen to have chosen.
cxoadvisory.com - GMO forecastscxoadvisory.com - Wp contentThings do tend to mean revert to a large extent, but the time frame is pretty variable. There is no telling what things will be like at any SPECIFIC future date.
(as an aside, my forecast for Berkshire was the same method, and even more primitive: assume inflation + 7%/year book per share growth as a proxy for conservative share value growth, and an ending multiple of 1.43)
Jim
* this is the problematic part. Depending on how much history you choose, you can get almost any number to reinforce your preconceived notions : )
I used to use deep history, then I started using history only since 1990 or 2000, then I gave up the notion that the broad US equity market would ever return to any prior notion of normal valuation levels as a future average "normal" level. I still think it will likely move in the *direction* of the old normal--extreme highs probably mean a drop and vice versa--but not necessarily that it will mean revert in any particular time frame, nor by any specific amount.